While AML transaction monitoring systems are common helpful tools used to identify suspicious activity, they require threshold setting and tuning for scenarios. In this article, I propose an analytical approach is to replace some time-consuming activities (alert sampling and investigation) which constitutes approximately 50% of the total effort for initial threshold setting and below the line analysis.
Scenario tuning basics
To start, here are some definitions for scenario tuning:
- Initial Threshold Setting (ITS) is conducted to set a threshold when alert disposition history is not available, It is considered a best guess using sampling and investigative surveys.
- Below the Line (BTL) is conducted to test if the current threshold needs to be lowered to cover an area where alert disposition history is not available, using sampling and investigative surveys.
- Above the Line (ATL) is conducted to evaluate scenario parameters against historical alerts to determine if the thresholds should be increased to reduce false positives.
ITS and BTL are the similar exercises as their main idea is predicting good (review-worthy) or bad (not review-worthy) alerts at the unknown threshold regions to decide scenario thresholds by covering productive alerts. To do this, we use scenario emulators to generate synthetic alerts for the unknown alert region. We use alert sampling to decrease the alert counts for the bank investigators' output and then they label sampled alerts as review-worthy or not. Lastly, the compliance team sets the final thresholds depending on the investigators' outputs.
The most challenging part is when bank investigators require outputs for alerts with no disposition; it takes a lot of time and effort. Often times, banks do not want to spend their investigative resources for this kind of work.
K Nearest Neighbour Method (KNN)
K Nearest Neighbour method can be used to replace alert sampling done by consultants and alert investigation done by bank’s investigators.
K Nearest Neighbour is an algorithm that stores all the available observations and classifies the new data based on a similarity measure (Euclidian distance). It is mostly used to classify a data point based on how its neighbours are classified. In classification problems, the label of potential objects is determined by the labels of the closest training data points in the feature space. The determination process for classification use cases is done by "majority voting." In "majority voting," an object is labelled according to the most frequent label among the k closest training examples.1
In the example below, let’s assume that the red triangles represent review-worthy alerts, the blue squares represent not review-worthy alerts and the green circle represents unknown alert disposition. If k is 1, then the new alert gets assigned as bad (the alert closest to the circle is bad). If k is 3, it gets assigned as good (the closest three alerts: one is bad, two are good).
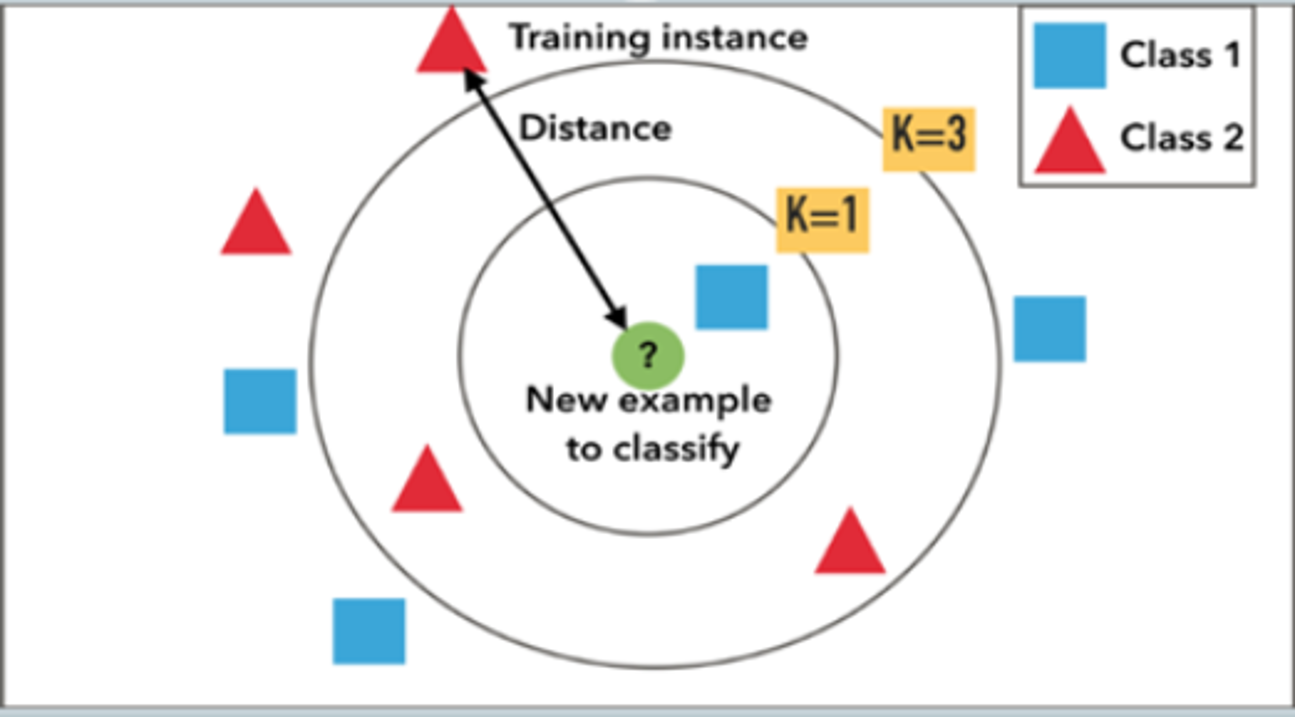
Deciding what k is represents is critical. A small value of k means that noise will have a higher influence on the result. A large value makes it computationally expensive and defeats KNN's basic philosophy of nearby points possibly having similar densities or classes. A simple approach to set k as k=n1/2.2
As seen in this example, K Nearest Neighbour algorithm can be used to predict alert productivity for the unknown alert dispositions based on the similarity of the known alerts. The analytical base table will be on an alert level so scenario-based input variables are used to calculate similarity and predict the target for unknown alerts. Here are some of the input variable examples:
- Total foreign wire transaction amount in the past x days
- Percentage of total Wire/Cash deposit amount over total deposit amount in the past x days
- Percentage of total Wire/Cash withdraw amount over total withdraw amount in the past x days
- Sum of deposit transaction using a third-party check in the past x days.
For BTL, we know the alert dispositions (target) for the investigated alerts. For ITS, there is no alert disposition so customer risk assessment or fraud data can be used to label alerts generated by scenario emulators.
KNN saves time and effort!
Are you wondering how much effort this method saves? The table below shows the ITS/BTL effort estimates for 1 scenario:
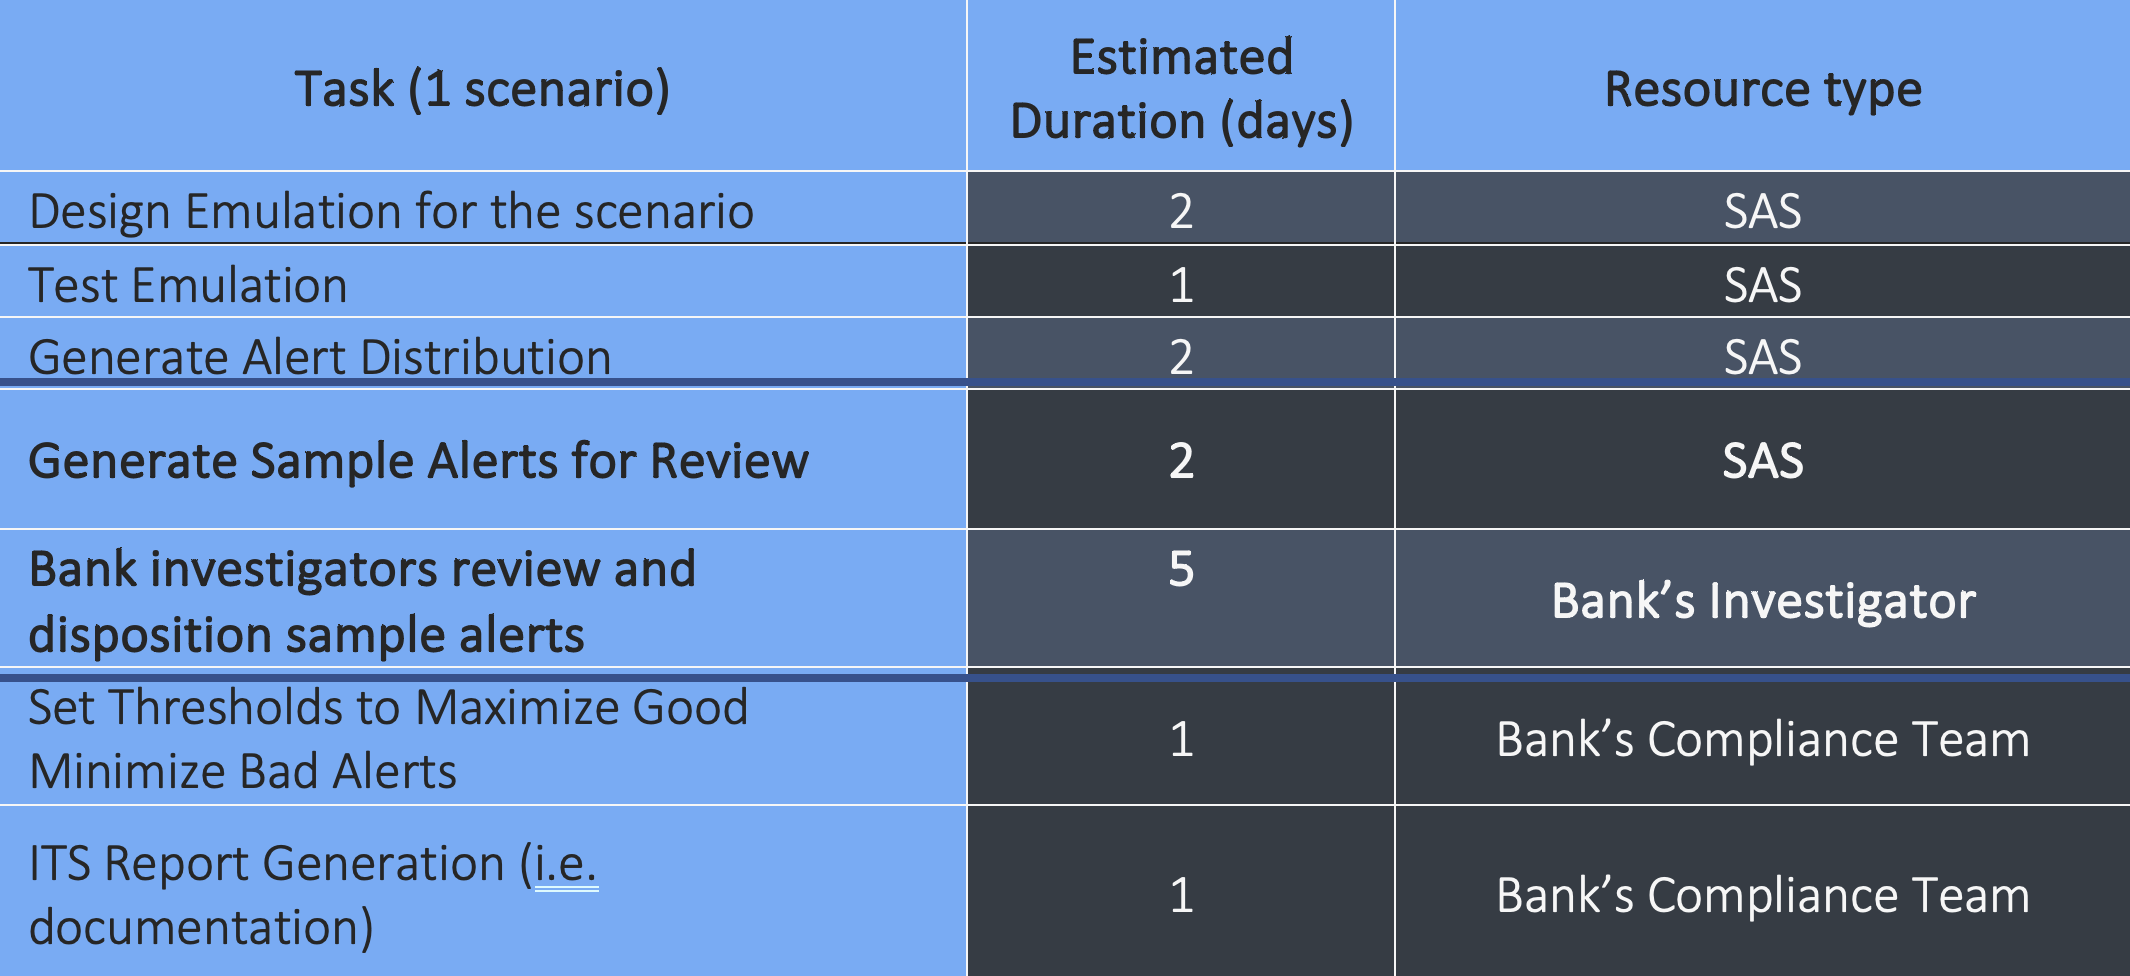
On average, scenarios ran through the ITS or BTL process take 14 days end-to-end to complete. 50% of this effort (7 days) can be saved by replacing sampling and investigator involvement by using K Nearest Neighbour algorithm. This approach also provides more accurate results since it removes potential human error.
To summarize, implementing a K-Means Neighbour algorithm may take only 20 days. Considering that banks have 20-30 transaction monitoring scenarios on average, a production currently using ITS or BTL exercises can save between 120 and 190 days.
1: KNN Classification and Regression using SAS
2: Value of k in k nearest neighbor algorithm
